A case study
DevOps monitoring system
Real-time monitoring, analytics, and data visualization.
Client & Domain
A company (NDA) specializing in providing 3D design solutions, including software development, system integration, and IT consulting.
Project description
The company faced the need to enhance the efficiency of its IT infrastructures through the implementation of monitoring systems.
The existing monitoring system was costly and did not provide the necessary flexibility and scalability.
After the evaluation we defined
Pain points that required a solution
Engaged team
Technologies & Tools
 Grafana
  Kubernetes
  Prometheus
  Loki
Loki  Helm
Helm Learn in details
How our solution helped the customer
Abandoning expensive solutions in favor of open source tools
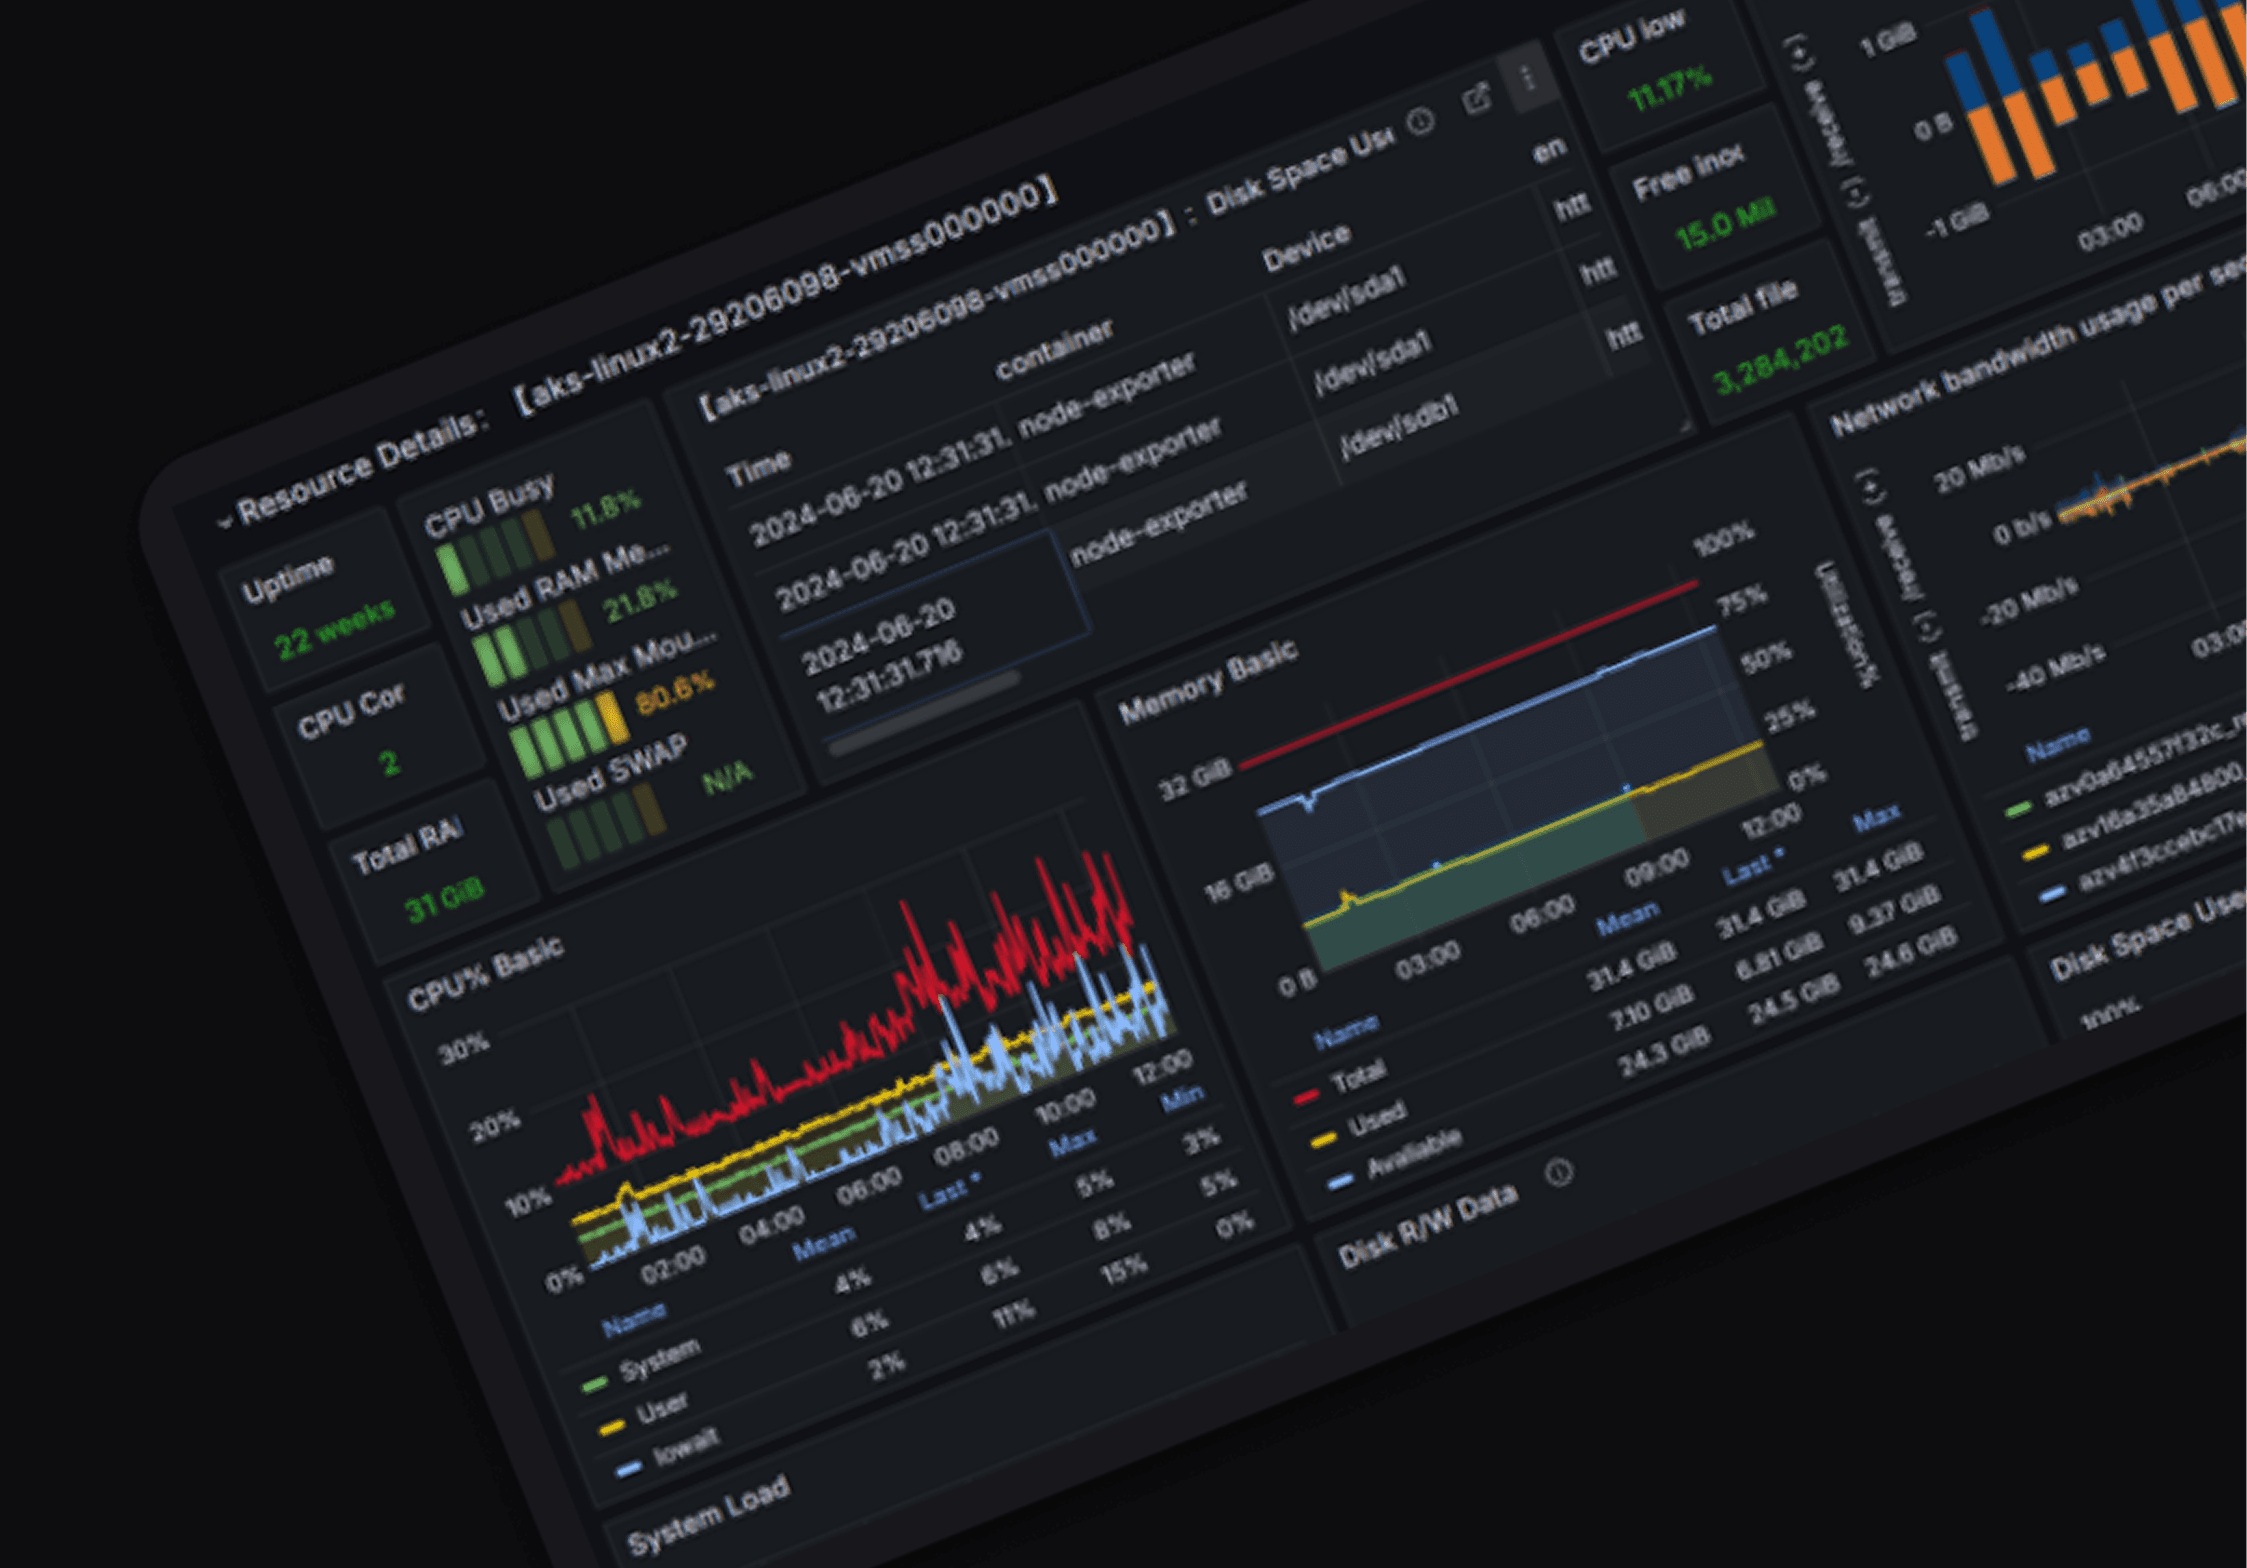
We built a smart monitoring system using open-source tools, helping the company save money and get better insights into how their services are performing and staying available.
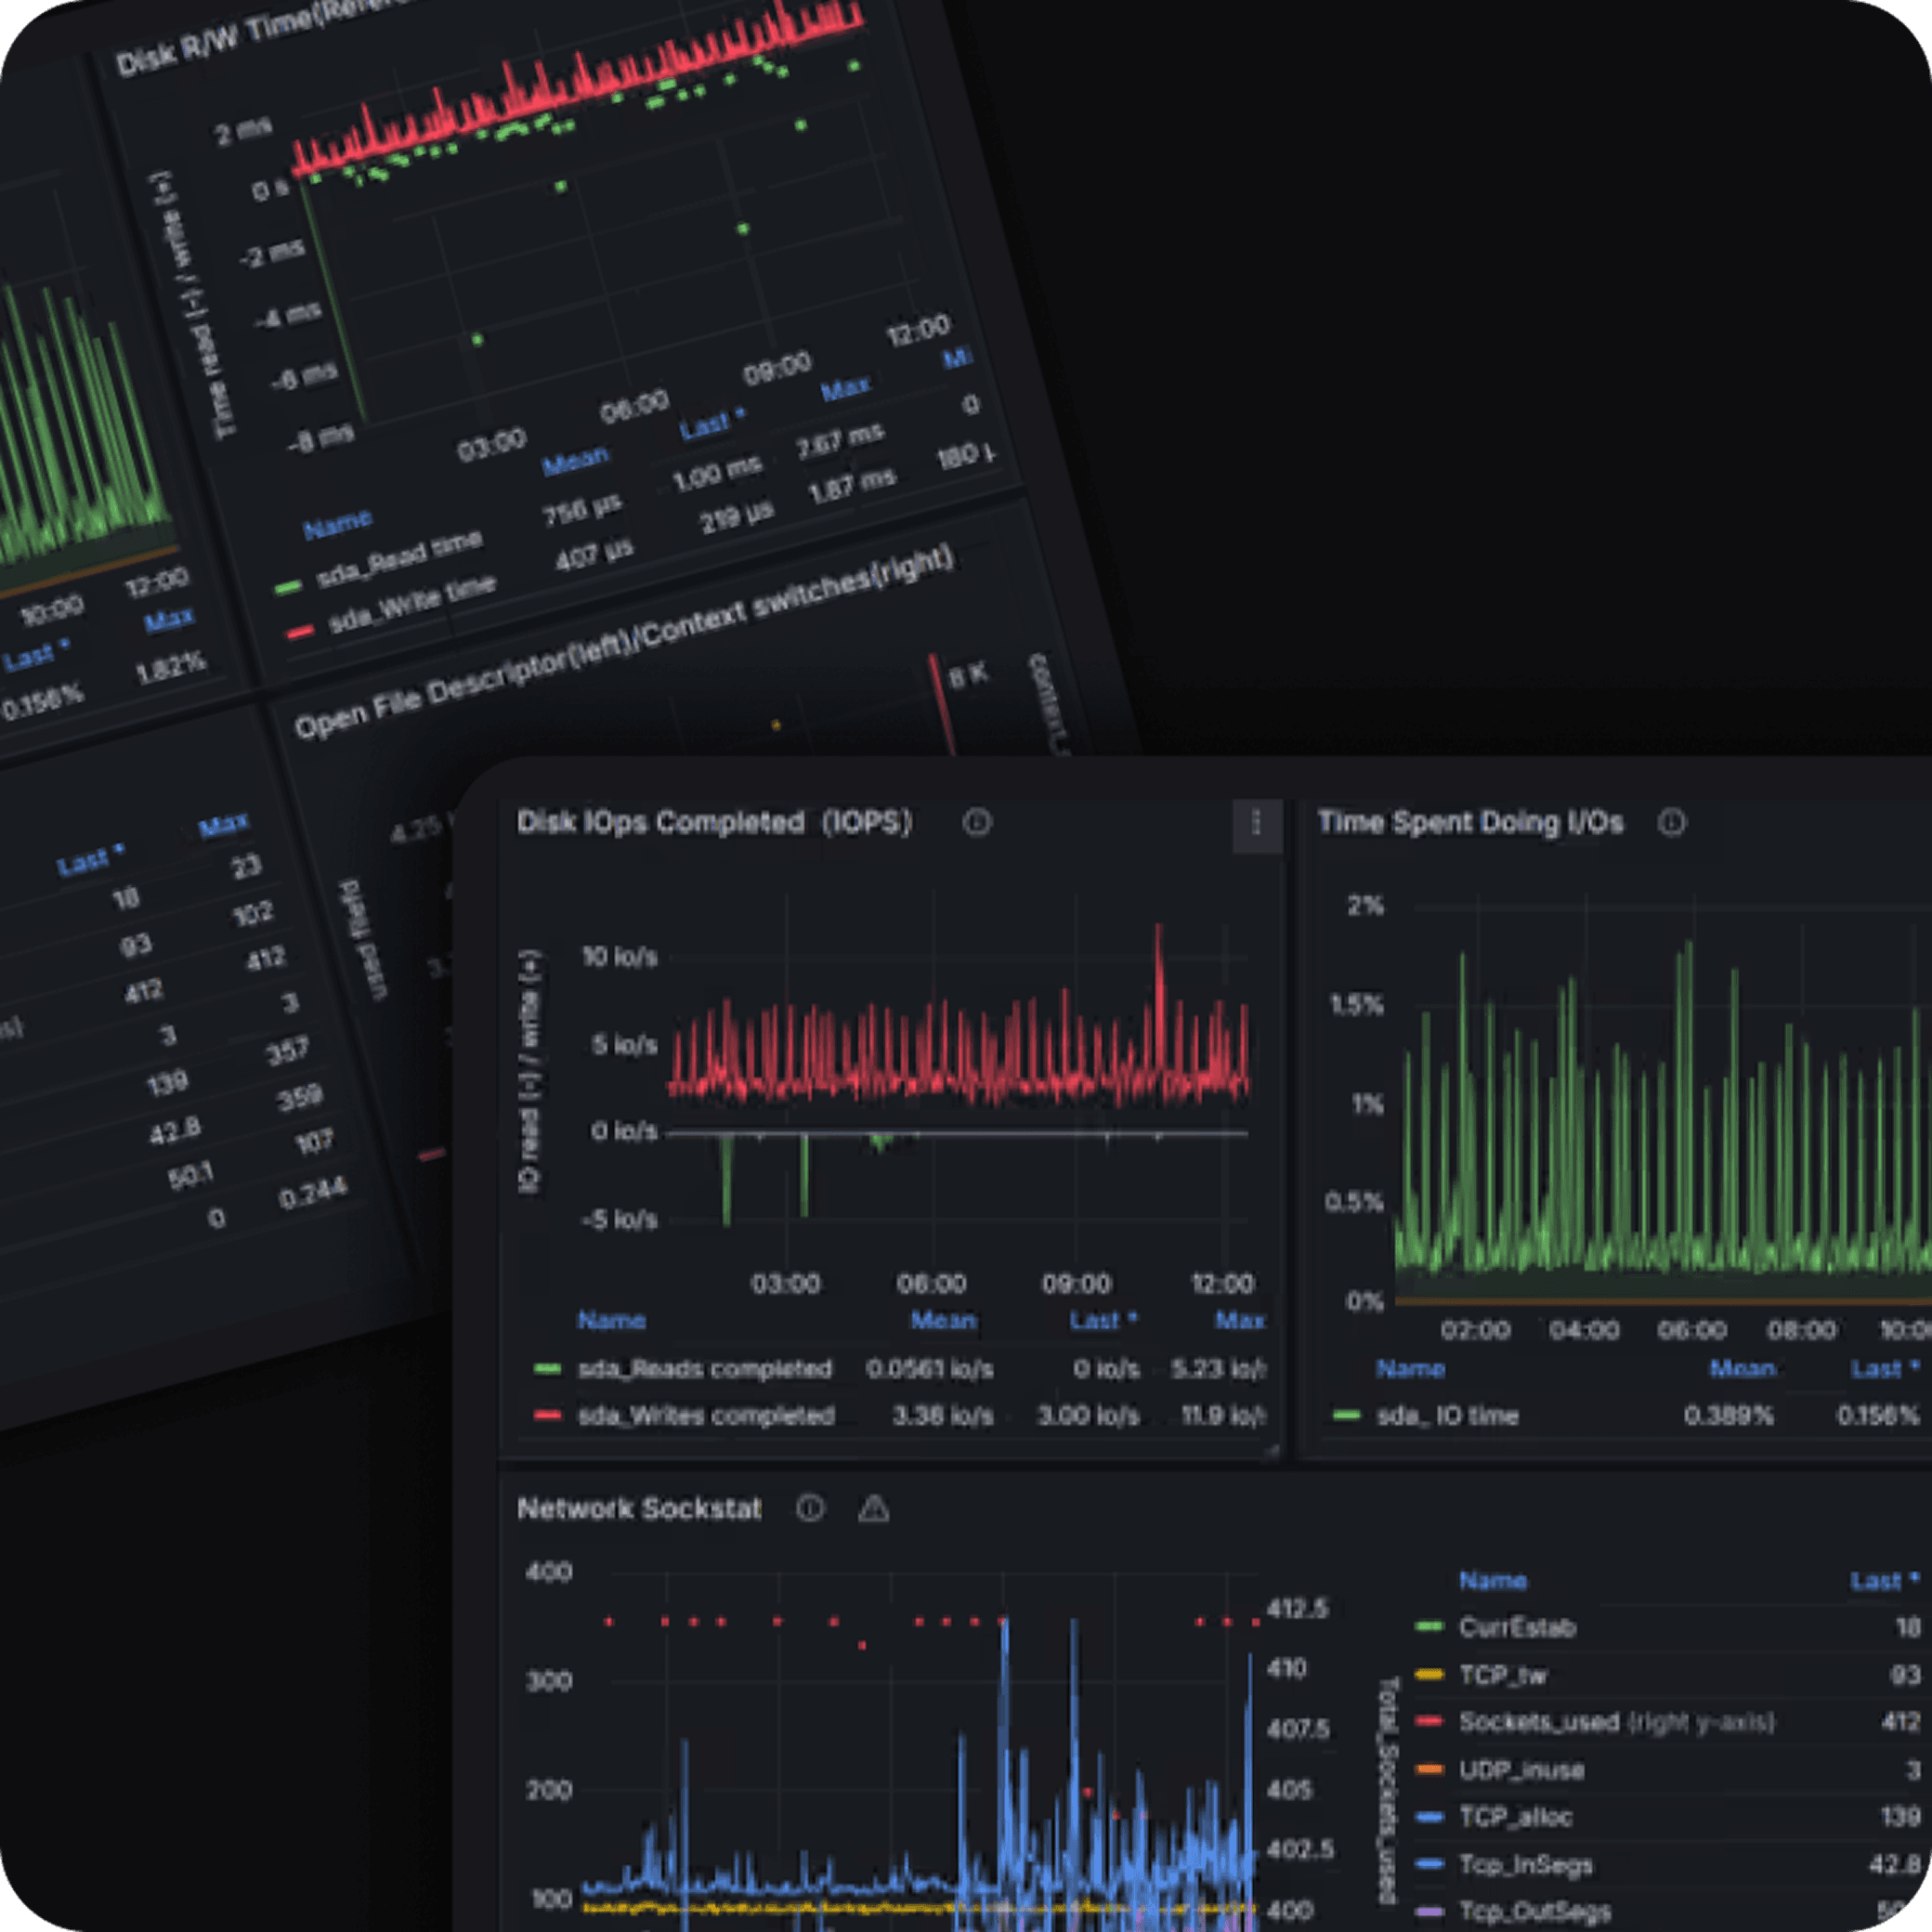
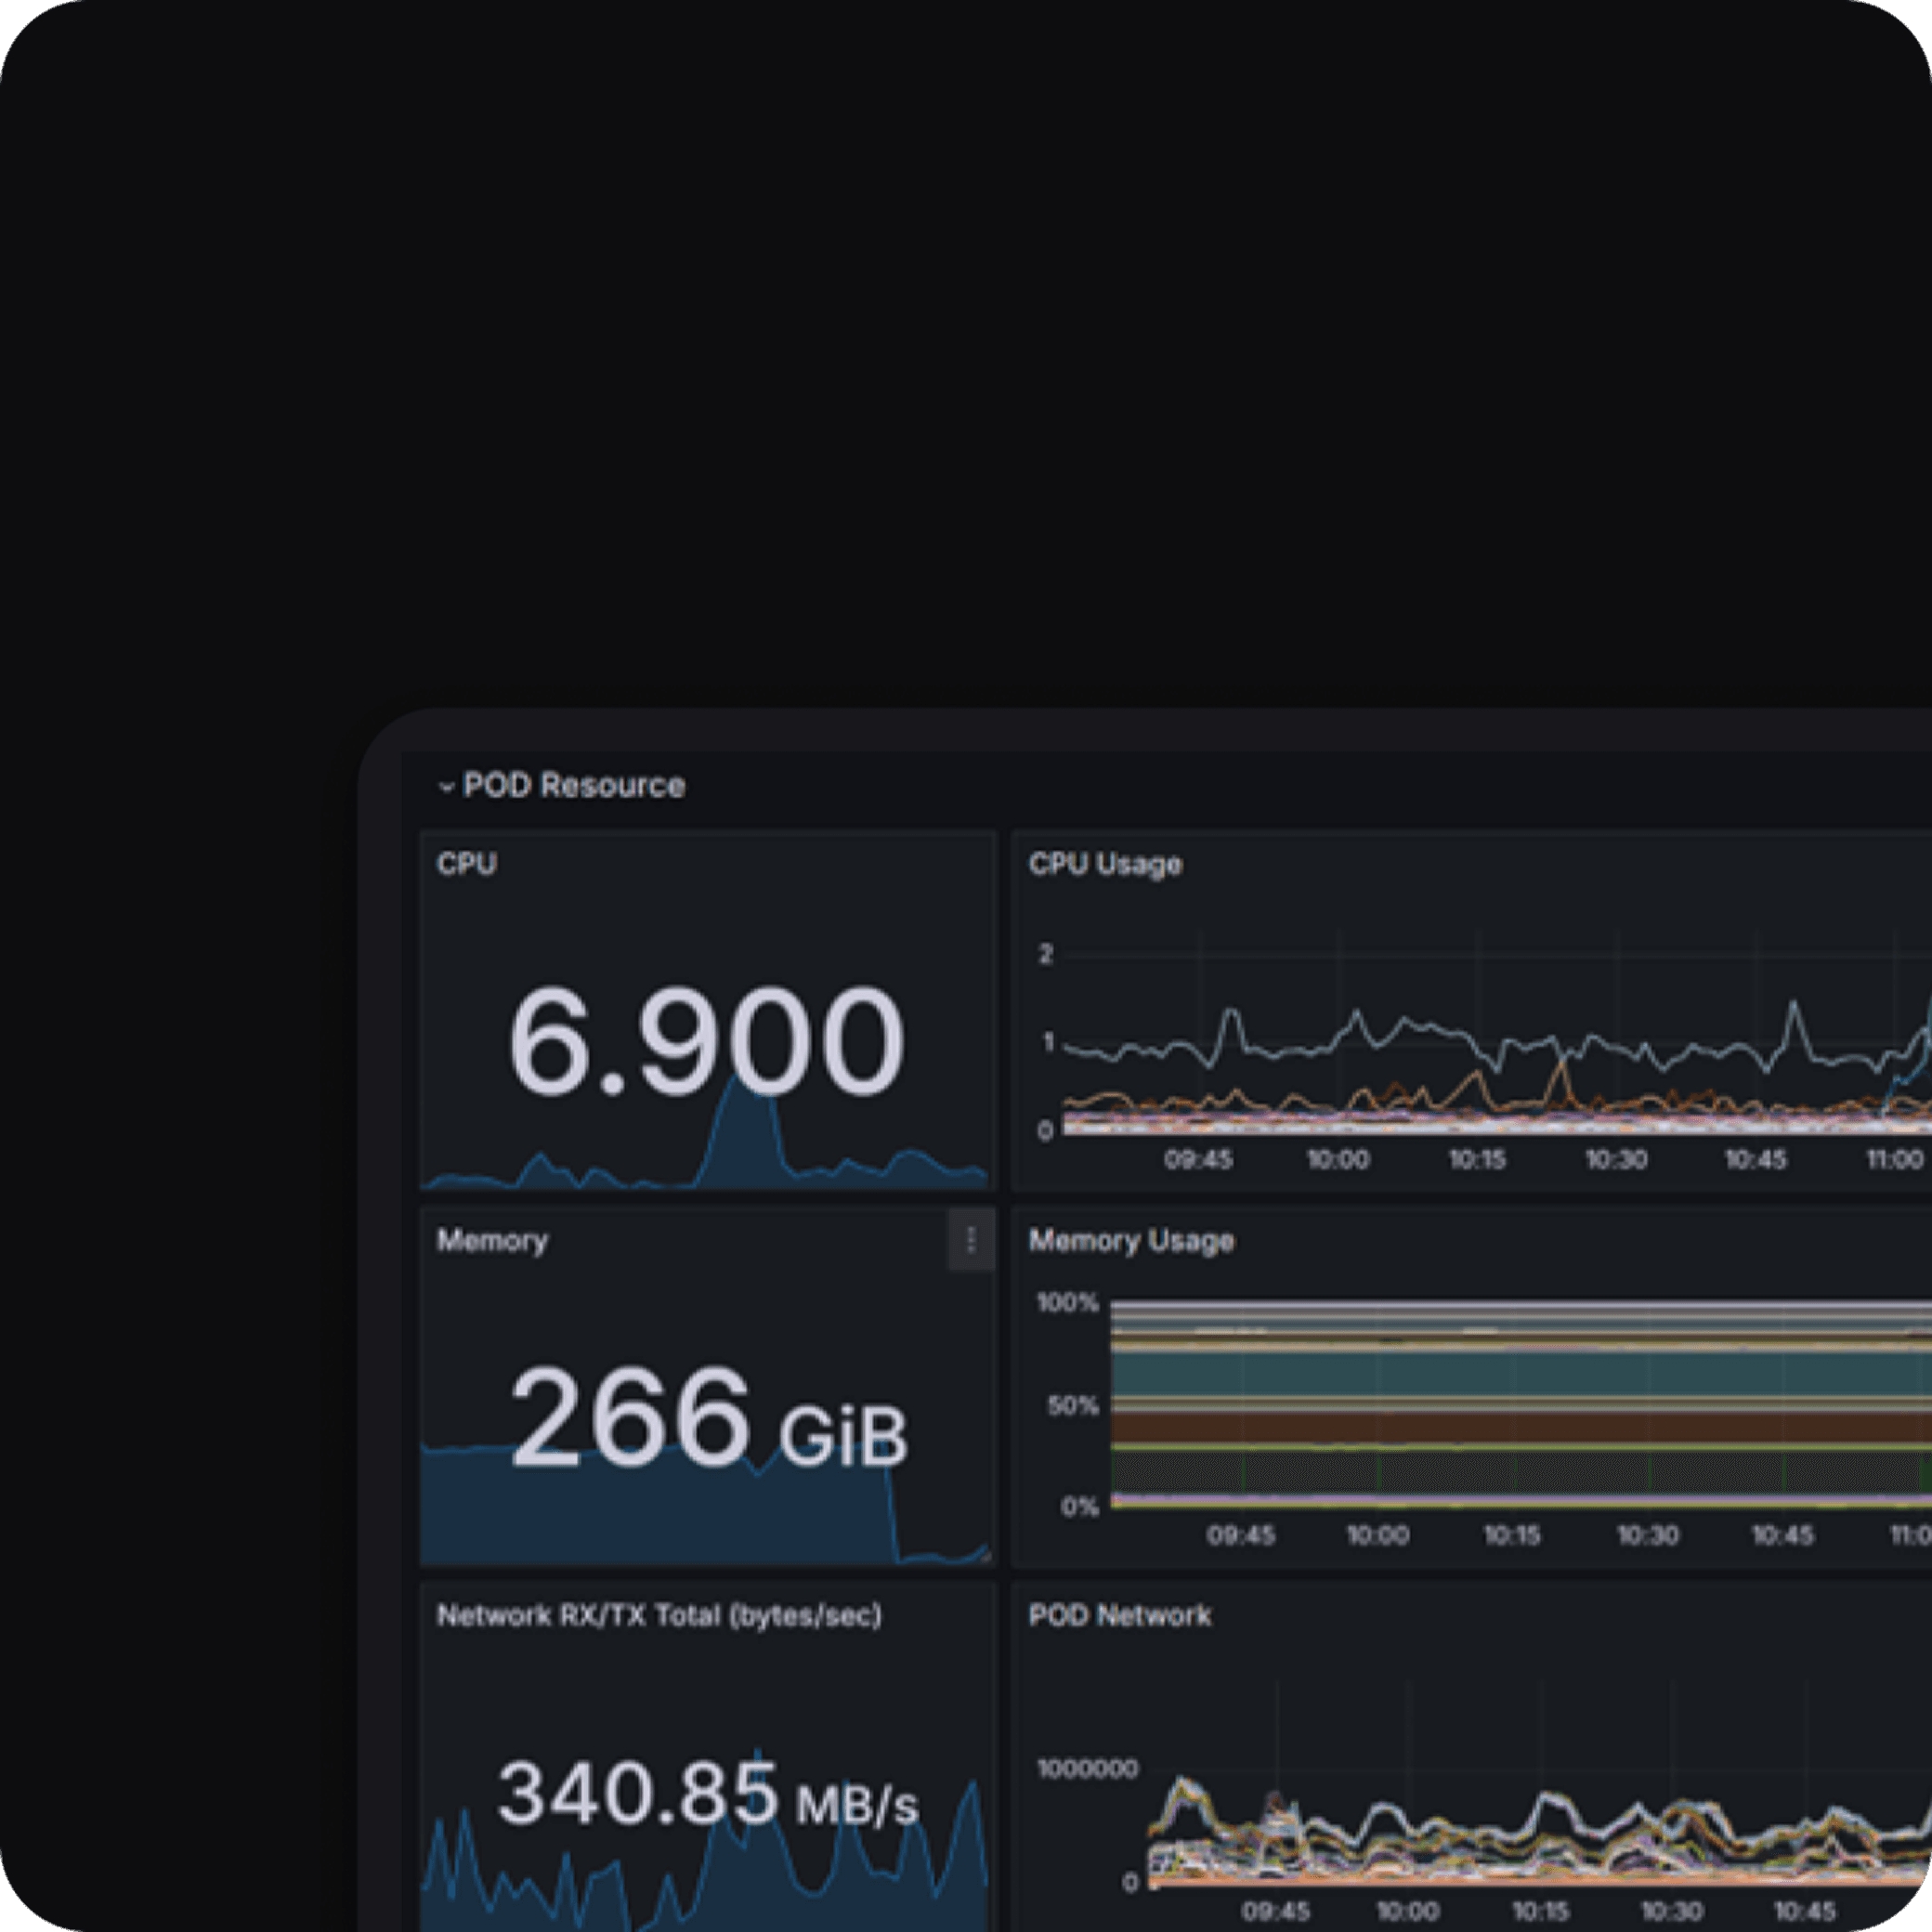
The system uses Grafana for data visualization and alerts, Prometheus for metrics collection, and Loki logs aggregation.
Efficient ecosystem
Together, these tools help the team quickly spot and fix issues, keeping everything running smoothly and efficiently.
Numbers that speak for themselves
Outcome as business metrics
Up to -1.500 USD/m
Saving up to -1.500 USD per months by unsubscribing from expensive licenses.
1.5x speed
A significant increase of incident response time, allowing more stable service delivery.
-30% Unplanned downtime
Reduced unplanned downtime by 30% allowing for more .
Client’s feedback
Robert W.
NDA, USA
Since the implementation, we’ve significantly improved our service availability and reduced troubleshooting time. On top of that, open‑source tools helped us keep costs under control without sacrificing quality. Overall, the system runs smoothly, delivers real value. Feels great to have confidence in the stability of our services.
See other projects
Tell us about
your project
We are ready to sign an NDA to protect your intellectual property. Your idea stays yours.
Build an efficient solution to your problem
My consultation is free.
No strings attached.
Let’s connect and build a solid IT foundation for your business.

Yaroslav Zhmayev
Solution Architect, CTO